Cloud native incident response in AWS - Part II
Introduction
Welcome back to the second part of our AWS Incident Response series. In the previous blog, we started with an overview of the types of services we can leverage for cloud native incident response. In this blog we will go further with our favourite service Athena, we will show you how to quickly load data and search for interesting events. As an extra goodie we have developed an Athena Cheatsheet to help you search smarter in Athena!
Want to level up your cloud incident response game? Register now for our AWS incident response course and you will be alerted when it goes live.
Background
When faced with an incident response you want to be able to respond quickly. In most AWS environments a client will have some logging available, at a minimum there will be CloudTrail logging available in a S3 bucket somewhere. In more mature environments, you might have other logging such as S3 access logging for high value buckets or network logging from your instances or network devices. Regardless the ability to quickly triage is very valuable when doing incident response.
Athena
With Athena we can achieve all of the above, it's a serverless offering which is very flexible. Some basic things we need to understand when working with Athena are:
- Indexing and Partitioning
- Log support
- Query language
Indexing and Partitioning
Data is not indexed in Athena, it just allows you to search through data that is stored somewhere else (e.g. S3 bucket). So don't compare it to a log management solution or a SIEM, because it doesn't work like that. Athena just queries the data, but how does Athena know what fields there are and the data format? Enter Glue (docs), this service makes the data available to Athena for searching. Glue catalogs the data and defines a schema for the data so Athena knows what is available. That is the very short summary.
Another really important thing that Glue provides is partitions, this allows you to limit your searches to data you are interested in. Let's look at an example CloudTrail folder in S3:
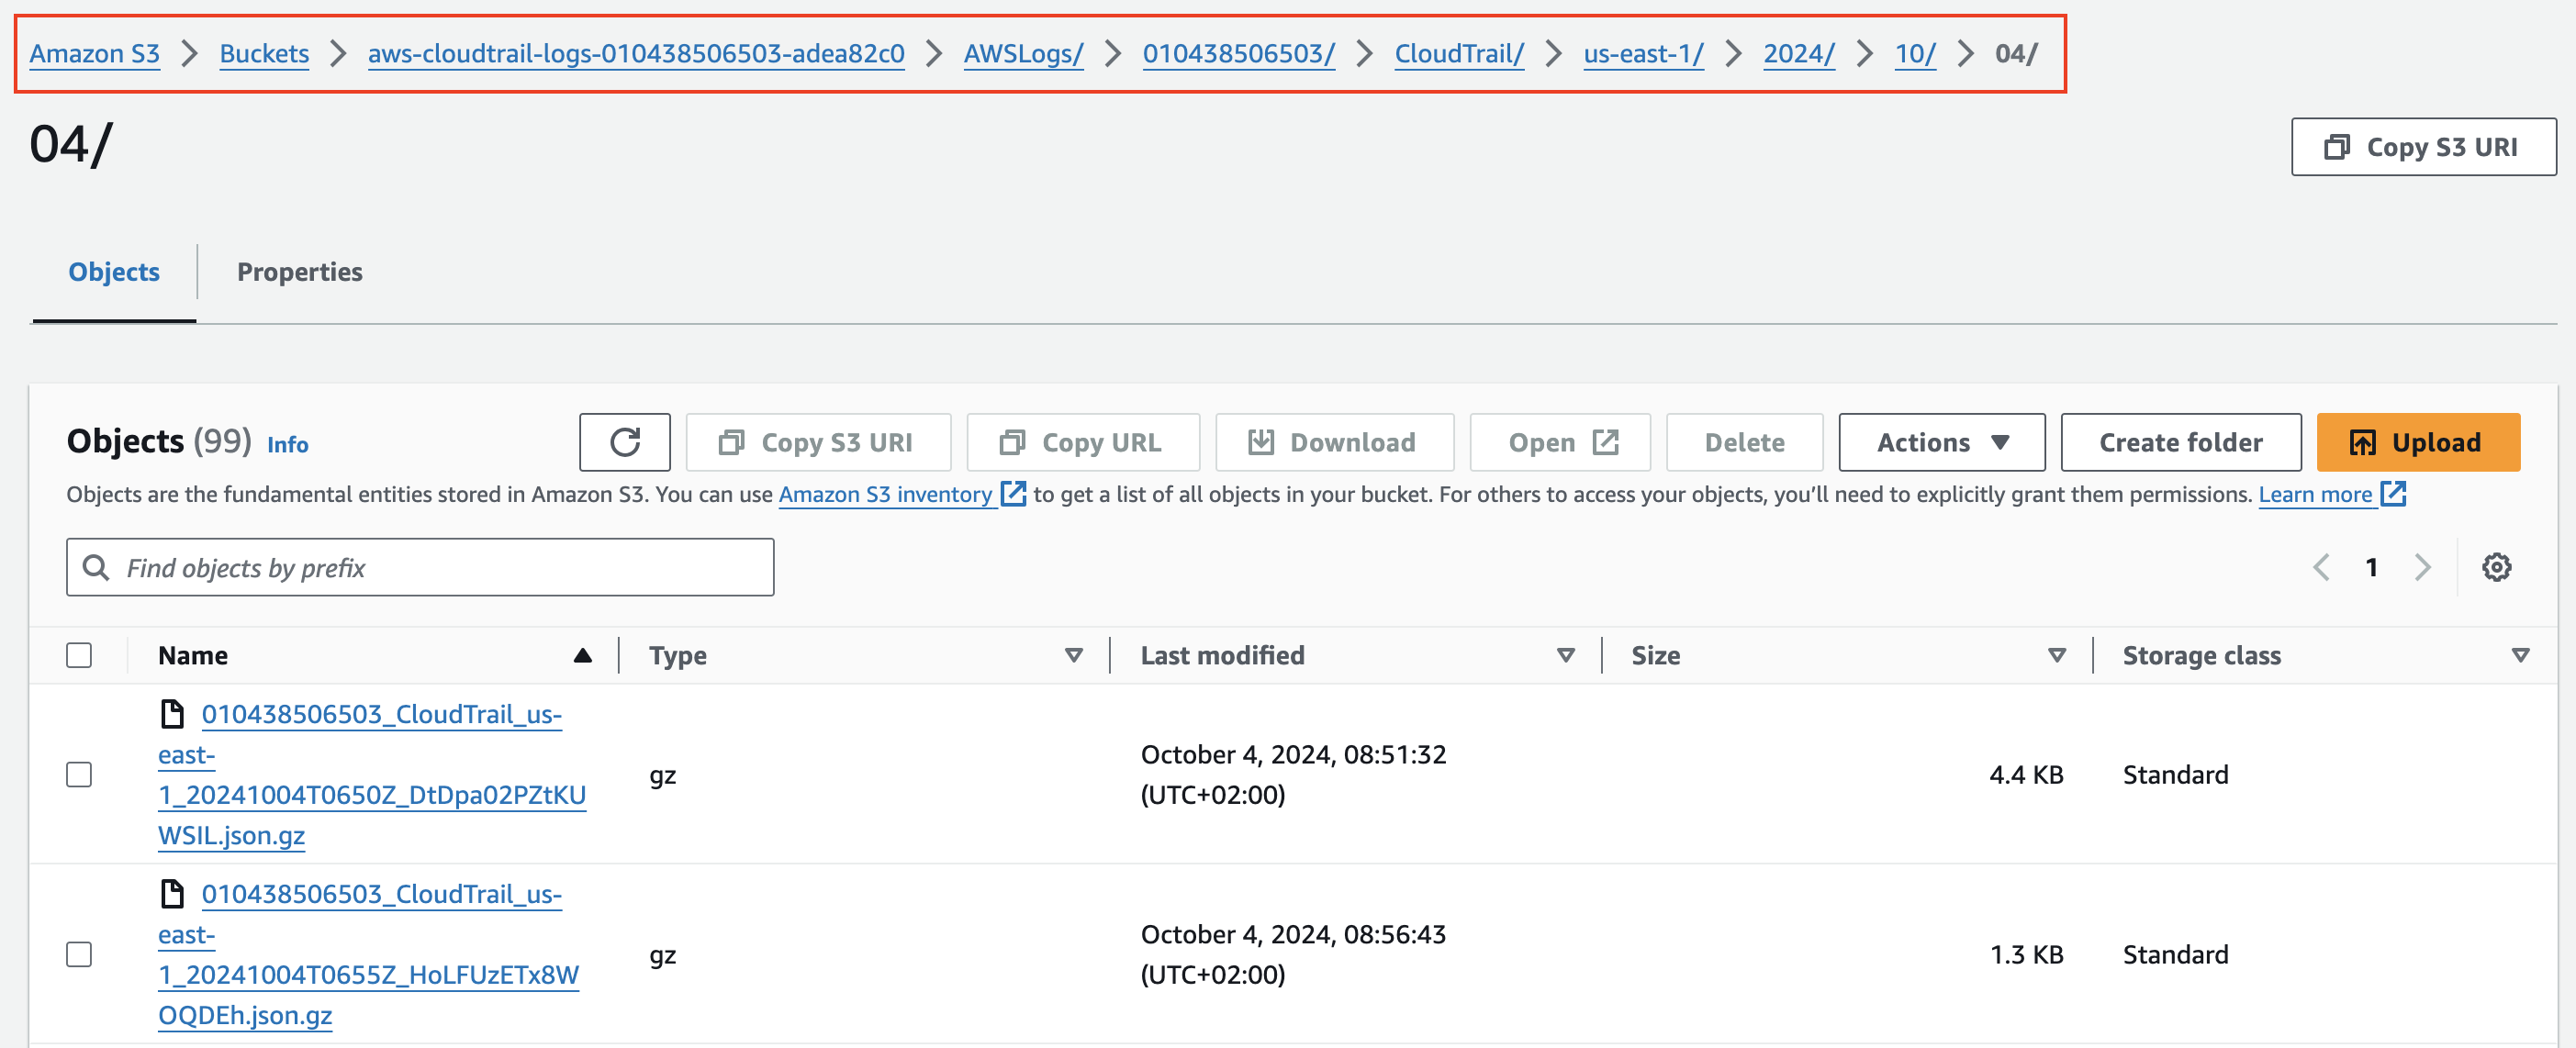
As you can see the data is stored in the folder CloudTrail, with the structure $region/$year/$month/$day/$hour. What a partition allows you to do is, tell Glue this is the structure/path to our data use that as a partition. Now in Athena you can simply say region=us-east-1 and it will only search inside the path CloudTrail/us-east-1. Why is this important to understand? Well each query is charged and the amount depends on the data that Athena/Glue has to search through. So if you can limit the data it needs to scan you will have lower charges ($$). It also speeds up the query significantly if it only needs to scan one region or year or month. That is why partitioning is important. To quickly check if a table in Athena is partitioned you can look at the tables and it will tell you as shown below:

Log support
The following logs are supported directly in Athena, meaning there's official documentation and loading instructions for these log types. The table below shows the most common logs you will encounter in incident response and a link to the loading instructions:
Data loading
With the instructions above we can load in our data, to load in data we need to know two things:
- Data location (S3)
- Loading instructions (DDL)
Data location
Assuming your logs are stored in S3, all you need to know is the location of the log file for example to load in our S3 access logs:
s3://invictus-s3-access-logs/
Loading instructions (DDL)
Next we will load in the data, using a Data Definition Language (DDL) statement, the instructions can be found using the links in the table above for the major data sources, one example for ELB access logs:
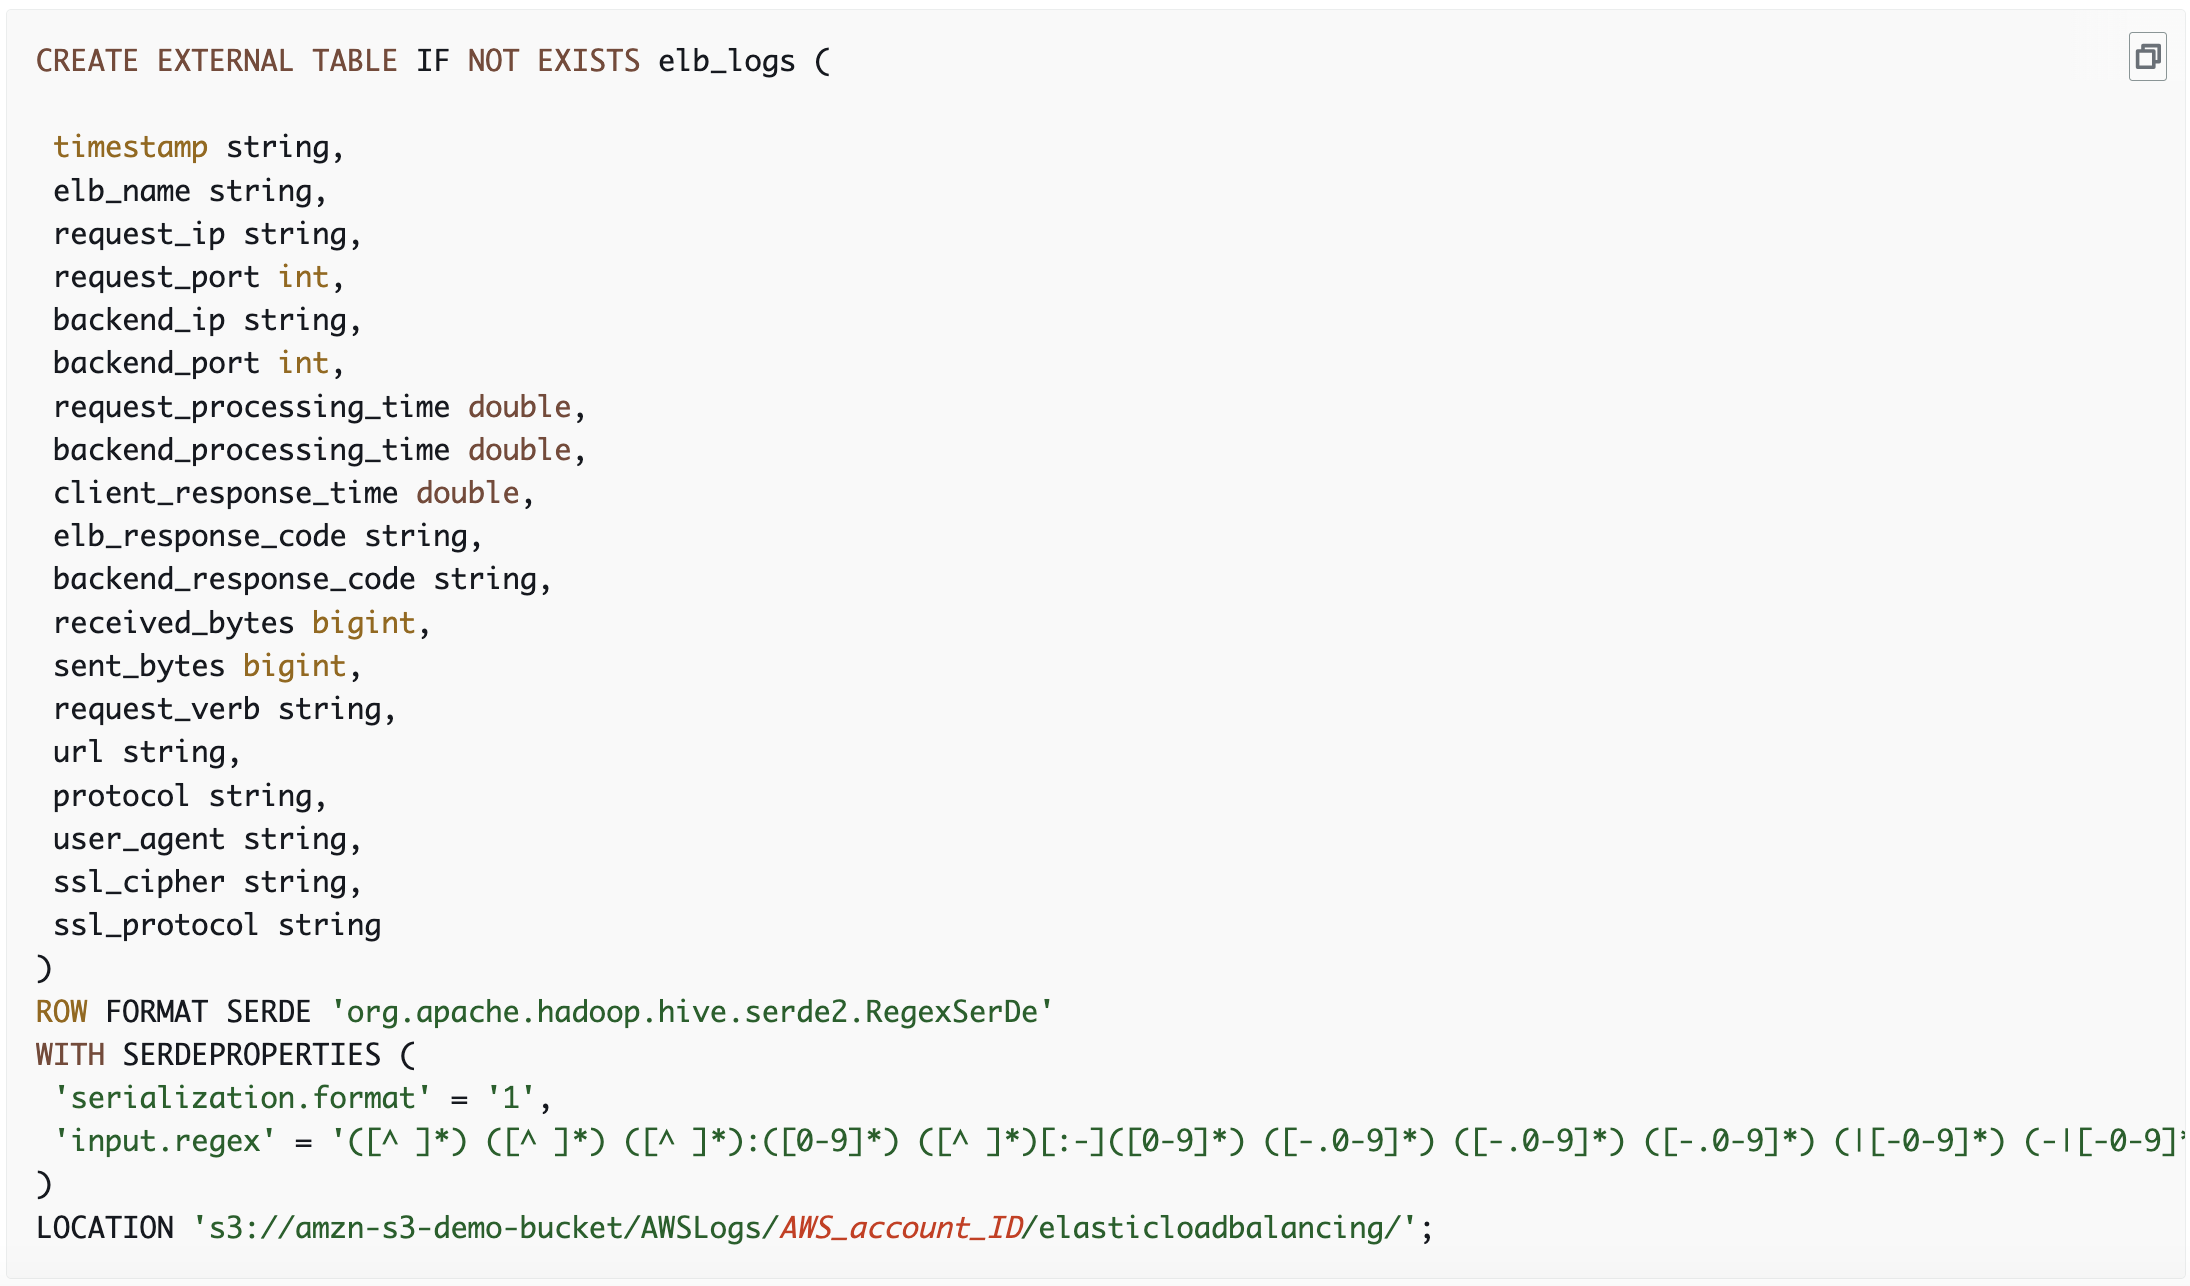
The only thing we need to change to load in our ELB access logs is the LOCATION at the bottom and now you have your ELB access logs in an Athena table called elb_logs which is defined on the first line of the DDL statement. Each data source will need its own DDL in order to make sure data gets properly parsed.
Analysis
Some tips when searching through log files in Athena:
Limit the output, each query is charged, therefore make sure you limit the output of your queries. Don't run SELECT * FROM TABLE if you want to understand what fields are in the dataset. Just run SELECT * FROM TABLE LIMIT 10 to get 10 events back. The reason is that Athena wil charge you based on the number of data it needs to search through so if you don't limit it you can have some unwanted costs and even services that time-out.
Reuse query results, this button/option is very useful when doing analysis. It will reuse query results and you can set it for a period between 60 minutes and the last 7 days. The query below retrieves all AssumeRole events in the dataset, but if we want to limit that down to an IP address or Role ARN we can simply add that to the query and run it again, and it will reuse the results. This improves both performance and it limits costs. Beware though, if you are looking at live data that if you set this to reuse results it will not include recent events.

Nested objects, in AWS logs you will probably encounter some fields with nested objects that you want to search or aggregate on, let's look at an example that shows the useridentity and the requestparameters field.
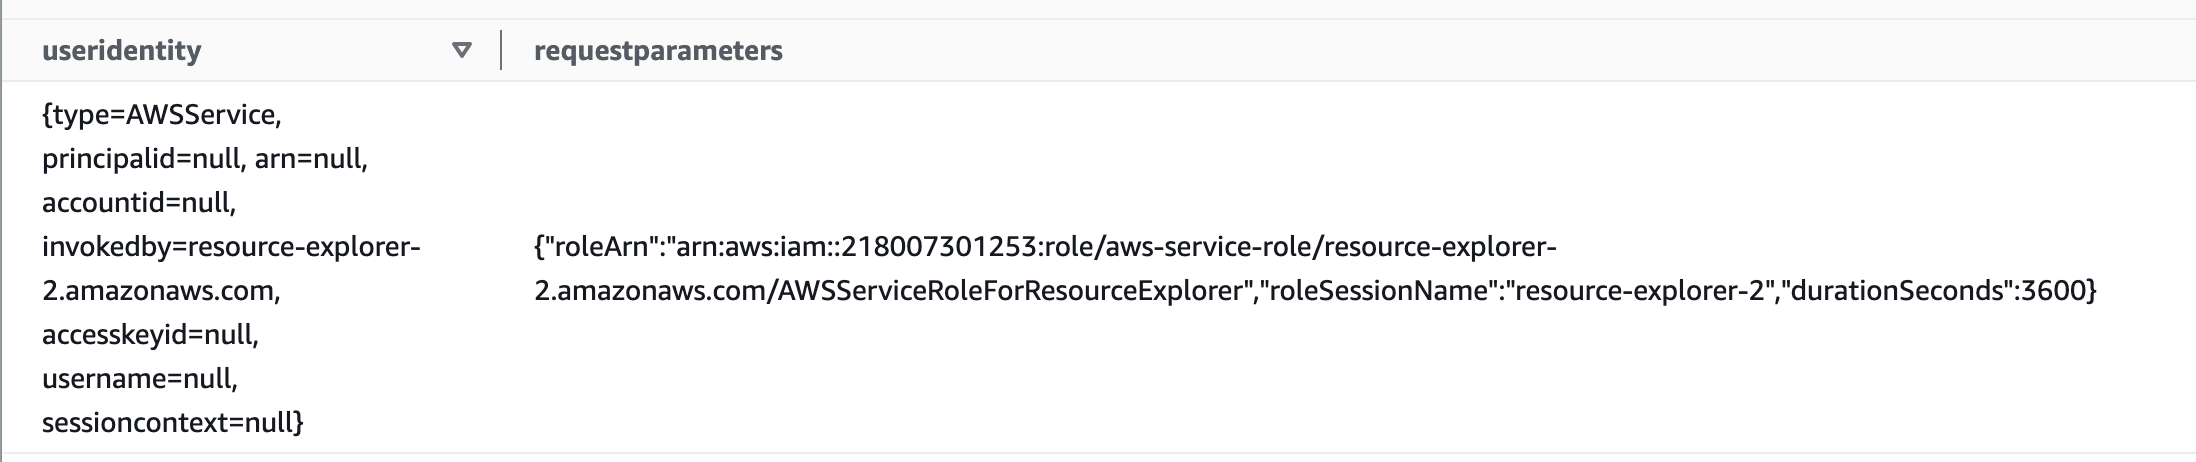
Both fields have nested objects, let's say we want to grab the type from useridentity and the roleSessionName from requestparameters. We can do this in multiple ways, because the useridentity field is defined in the DDL loading statement as a STRUCT field we can directly access its objects using the '.' so we can say useridentity.type or useridentity.username. However the requestparameters field is defined as a STRING so we have to use a built-in Athena function called json_extract_scalar. This function can search through fields and extract objects. Using the below query we can grab the fields we want:
SELECT
useridentity.type,
json_extract_scalar(requestparameters, '$.roleSessionName') AS roleSessionName
FROM cloudtrail_logs
WHERE eventname = 'AssumeRole'
ORDER BY eventtime DESC
LIMIT 10

(Bonus) Athena Cheatsheet
So how do you find the bad guys using Athena? That is the million dollar question that we attempt to answer in our training that goes live this week, register now if you haven't done so already. However, we won't just leave you with a sales pitch. We have developed a cheatsheet to help you get better at searching logs with Athena. Please find the cheatsheet below, and you can grab it from our GitHub and also make PR's or Issues if you have suggestions for improvement.

Conclusion
In this blog you have seen the power of Athena for incident response, whether you host it in your environment or the client environment. The fact that you don't have to index your data and can just point to a location with logs and start searching for indicators of compromise is very powerful. It also has some drawbacks and against large datasets the solution might become slow(er). For us we love using Athena in engagements and I hope you will love it too for cloud native incident response.
About Invictus Incident Response
We are an incident response company and we ❤️ the cloud and specialise in supporting organisations facing a cyber attack. We help our clients stay undefeated!
🆘 Incident Response support reach out to cert@invictus-ir.com or go to https://www.invictus-ir.com/24-7
Be ready for the next cloud incident.