The Missing Link: AADGraphActivityLogs Finally Arrives
Introduction
It’s been a long time coming. If you’re like us, you’ve probably been waiting since at least May 2025 for logs to appear in your SIEM after enabling AAD Graph Activity Logs in Entra ID.
After a year of checking an empty table, the wait is finally over. The AADGraphActivityLogs are here. For years, we as security professionals have dealt with a massive blind spot. While we got the MicrosoftGraphActivityLogs back in late 2023, giving us eyes on the modern API, the legacy Azure AD Graph API remained a blind spot.
Why This Table is a Game Changer
So why are we making such a big deal about a log for an API that Microsoft has been trying to retire for years? (And, knowing Microsoft.. it will probably still be around for a few more)
It’s simple: attackers love using the legacy Azure AD Graph because it has no logging. No logs means no visibility, and no visibility means no detection. From an attacker’s perspective, why use the modern Microsoft Graph, which has telemetry and monitoring, when you can operate through a legacy endpoint that keeps defenders in the dark? Tools like AADInternals and ROADtools took full advantage of this gap, making certain types of reconnaissance and abuse extremely difficult to detect.
Until now.
The Two APIs
To understand why this log matters so much, it helps to understand that there are actually two separate Entra ID Graph APIs that have existed side by side for years:
- Azure AD Graph API (graph.windows.net) — the original, legacy API that Microsoft has been trying to deprecate since 2019. If you ever used the classic AzureAD Powershell module, you were interacting directly with this API.
- Microsoft Graph API (graph.microsoft.com) — the modern replacement that Microsoft wants everyone to use.
In late 2023, Microsoft introduced MicrosoftGraphActivityLogs, giving defenders visibility into activity on the modern API. That was a big win, but it only solved half the problem. The legacy Azure AD Graph API remained completely unmonitored. Despite years of deprecation efforts, it stayed functional, widely supported. This created a perfect asymmetry: defenders had visibility into one API, while attackers could simply choose the other.
Acquiring The Logs
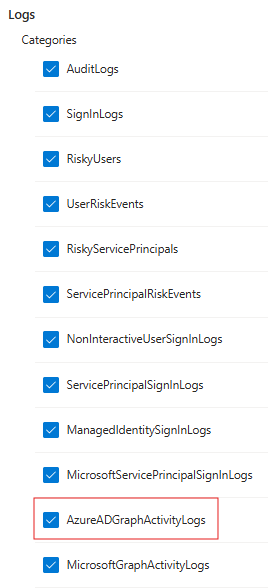
The log can be enabled through the Entra ID Diagnostic Settings. If you have ever configured Entra ID logs for Sign-ins or Audit events, you know the drill. Navigate to the Microsoft Entra ID portal, find Diagnostic settings under the Monitoring section, and click + Add diagnostic setting. You will see the new checkbox for AADGraphActivityLogs waiting for you. Simply check that box, choose your destination (like your Log Analytics Workspace), and you are good to go!
Analysing The Logs
On to the fun stuff. In this blog we will analyse the logs in a Log Analytics Workspace. The logs are stored within the AADGraphActivityLogs table in Log Analytics. The official documentation for the table and all of its available fields can be found here: AADGraphActivityLogs table reference. The schema for AADGraphActivityLogs is very similar to the MicrosoftGraphActivityLogs, but It wouldn't be Microsoft if there were not a few naming differences (for example: IpAddress vs CallerIpAddress). Here are some fields that are useful for incident detection and response:
But we aren't just going to list the fields. For this blog, we will focus on how you can use this table to finally hunt down and detect those attacker toolkits that have been hiding from us.
Detecting ROADrecon Activity
Before we dive deeper, we have to give a shoutout to Dirk-jan Mollema (@_dirkjan) for his incredible tools and research in the Entra ID security space. One of the tools in his arsenal is ROADrecon, part of the wider ROADtools framework. If you haven't used it, ROADrecon is the ultimate Entra ID exploration tool designed for both Red and Blue teams. It authenticates to your tenant, rapidly gathers all available information about users, groups, devices, roles, and service principals, and dumps it all into a local database. It then spins up a web-based GUI so you can visually explore relationships, permissions, and potential attack paths offline.
We ran the roadrecon gather command, waited a bit, and looked at the logs:
roadrecon gather
Starting data gathering phase 1 of 2 (collecting objects)
Starting data gathering phase 2 of 2 (collecting properties and relationships)
ROADrecon gather executed in 14.50 seconds and issued 2648 HTTP requests.
As shown in the output, the tool issued 2,648 requests in just 14.5 seconds. That is a massive amount of reconnaissance that we would have been completely blind to before!
So how can we detect this?
The first way to catch this activity is looking at the User-Agent field in combination with the sheer amount of requests. If you dig into the ROADtools source code, you'll see it using the aiohttp Python library for asynchronous HTTP requests library. In fact, if you look at the help menu for the gather module, Dirk-jan explicitly calls this out:
--user-agent : Custom user agent to use. By default aiohttp default user agent is used...
Because of this, unless the attacker explicitly uses the flag to spoof a standard web browser, we can use this information to detect on. The UserAgent field in your logs will look something like this: Python/3.12 aiohttp/3.10.4 (the exact version numbers will vary).
Here is a KQL query you can use to hunt for this exact behavior:
AADGraphActivityLogs
| where TimeGenerated > ago(1d)
| where RequestMethod == "GET"
| where UserAgent contains "python" and UserAgent contains "aiohttp"
| summarize RequestCount = count() by CallerIpAddress, AppId, UserAgent
| sort by RequestCount desc

But we can go beyond just “user-agent” detection and do behavioral fingerprinting. In the code, the exact sequence and type of objects the tool tries to gather are hardcoded. We can look for a single AppId or CallerIpAddress that hits a "Shopping List" of legacy endpoints in a very short window. This query is much more robust because even if the attacker changes their User-Agent, they are still following the tool's logic of hitting these specific endpoints.
Here is a KQL query you can use to hunt for this behavior:
AADGraphActivityLogs
| where TimeGenerated > ago(1d)
| where RequestMethod == "GET"
| extend TopLevelResource = tolower(tostring(split(split(RequestUri, "?")[0], "/")[3]))
| summarize
TopLevelResources = make_set(TopLevelResource),
AppIds = make_set(AppId),
CallerIPs = make_set(CallerIpAddress),
UserAgents = make_set(UserAgent),
StartTime = min(TimeGenerated),
EndTime = max(TimeGenerated)
by UserId, bin(TimeGenerated, 5m)
| where TopLevelResources has_all (
"users",
"tenantdetails",
"groups",
"applications",
"serviceprincipals",
"devices",
"directoryroles",
"roledefinitions",
"contacts",
"oauth2permissiongrants",
"authorizationpolicy")
| project StartTime, EndTime, UserId, AppIds, CallerIPs, UserAgents

Pivoting to the Sign-in Event
Every request in AADGraphActivityLogs contains a SignInActivityId field. This field is the bridge between what the attacker did and how they got in. It maps directly to the UniqueTokenIdentifier field in SigninLogs,with one small gotcha (again Microsoft being Microsoft): AADGraphActivityLogs stores it with padding (==) at the end, while SigninLogs strips it.
Once you account for that, the pivot works perfectly. The reconnaissance and the authentication method together paint the complete picture of the attack and both are now visible for the first time.
Following Everything in a Session
The SessionId field is another powerful correlation key. Unlike SignInActivityId which ties you to a single authentication event, SessionId groups every request made within the same session together. This means you can pull the complete picture of (almost) everything an attacker did after authenticating. This tenant-wide correlation key that links activity across multiple Microsoft sources:
- SigninLogs
- AADGraphActivityLogs
- MicrosoftGraphActivityLogs
- Unified Audit Log
Unfortunately, we can't link it to everything that was done since both the Entra ID Audit Logs and Azure Activity Logs don't yet have the SessionId field. Hopefully this changes one day.
Conclusion
The arrival of the AADGraphActivityLogs is a massive win for the Blue Team and a long-overdue fix for one of the most notorious blind spots in the Microsoft cloud ecosystem. For years, threat actors and red teams have abused the legacy Azure AD Graph API specifically because it allowed them to operate in the dark. With this new telemetry, the lights are finally on. Microsoft might keep the legacy Azure AD Graph API on life support for a few more years, but it is no longer a safe haven for attackers. The gap is closed, the telemetry is here, and it's time to put it to work.
Happy hunting!
About Invictus Incident Response
We are an incident response company and we ❤️ the cloud. We help our clients stay undefeated.
🆘 Under attack? Contact us now 🆘
Be ready for the next cloud incident.