This Is How We Do It: Resolving Microsoft Cloud Incidents Like Pros
As full time cloud incident responders we often come across similar challenges when doing incident response in Microsoft cloud environments. Normally we love to show off with some cool war stories. This blog post is different, we’ll walk you through our approach, hopefully, it’ll inspire some of you to try something similar. And we’d love to hear about your setups too! If you have any suggestions for improving ours, let us know. There's always room to improve. Happy reading!
The problem
You know how it goes, nobody likes doing the same task over and over again. As incident responders investigating incidents in Microsoft 365 and Azure, we found ourselves repeatedly asking clients for the same information and following the same steps. We thought, "There has to be a better way!" So, we decided to build one.
How we used to do it
In the early days, we relied on tools like the Microsoft Extractor (and eventually the Microsoft Extractor Suite), our process for gathering log data was slow and required manual work. We’d request clients to set up an account with the necessary permissions, and then, through delegated access, use that account to collect all relevant logs.
Here’s what investigating a security incident looked like:
- Request the client to create a dedicated account for the investigation
- Wait for them to complete the setup
- Manually gather all the required data
- Process the logs
- Analyze the logs
- Draft a report
- Repeat this process for each new client
It worked, but it wasn't exactly efficient.
Areas of improvement
To come up with a better way of doing things, let's start with areas where we can improve:
- Simplifying Account Setup
- (Slowly) embracing the Graph API
- Working around Graph API limitations
- Leveraging automation for log collection
- Automatic processing and detection
Let's dive deeper into each of these topics to see how we achieved improvements.
Simplifying account setup
In the past, getting started meant asking clients to set up an account for us. Today, we’ve simplified this by moving to a multi-tenant application model with all the necessary Graph API permissions. This setup allows us to register our acquisition application directly in the client’s environment.
How It Works
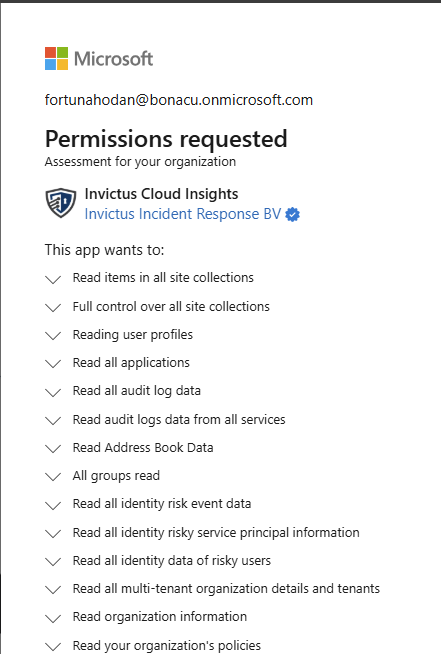
We’ve assigned the necessary Graph permissions, all of which are read-only, to our multi-tenant application. What’s great about the multi-tenant application is that we can easily register it in our client's environment. All they need to do is go to the following link with an account that has the appropriate admin permissions:
https://login.microsoftonline.com/${tenantId}/adminconsent?client_id={AppId}
The client will see a consent screen (shown below) asking them to approve the application. Once they consent, our application is registered in their environment with all the necessary Graph permissions to carry out most of the investigation. This makes deployment incredibly easy, clients can literally set it up with a single click in their environment!
The Graph API: Opportunities and Challenges
Microsoft is increasingly shifting toward the Graph API, so it’s only a matter of time before we’ll be able to conduct full investigations using just Graph API permissions. However, progress is slower than we’d like. Recently, the option to acquire the Unified Audit Log was added to the Graph API, but it’s currently not working, and parts of the documentation have been removed, making it unclear what’s going on. We reached out to Microsoft support, but the only response we received was a recommendation not to use beta features.
Still, the Graph API allows us to gather key logs, such as:
- Entra ID Sign-in Logs
- Entra ID Audit Logs
- Risky Detections and Users generated by Identity Protection
- OAuth Applications
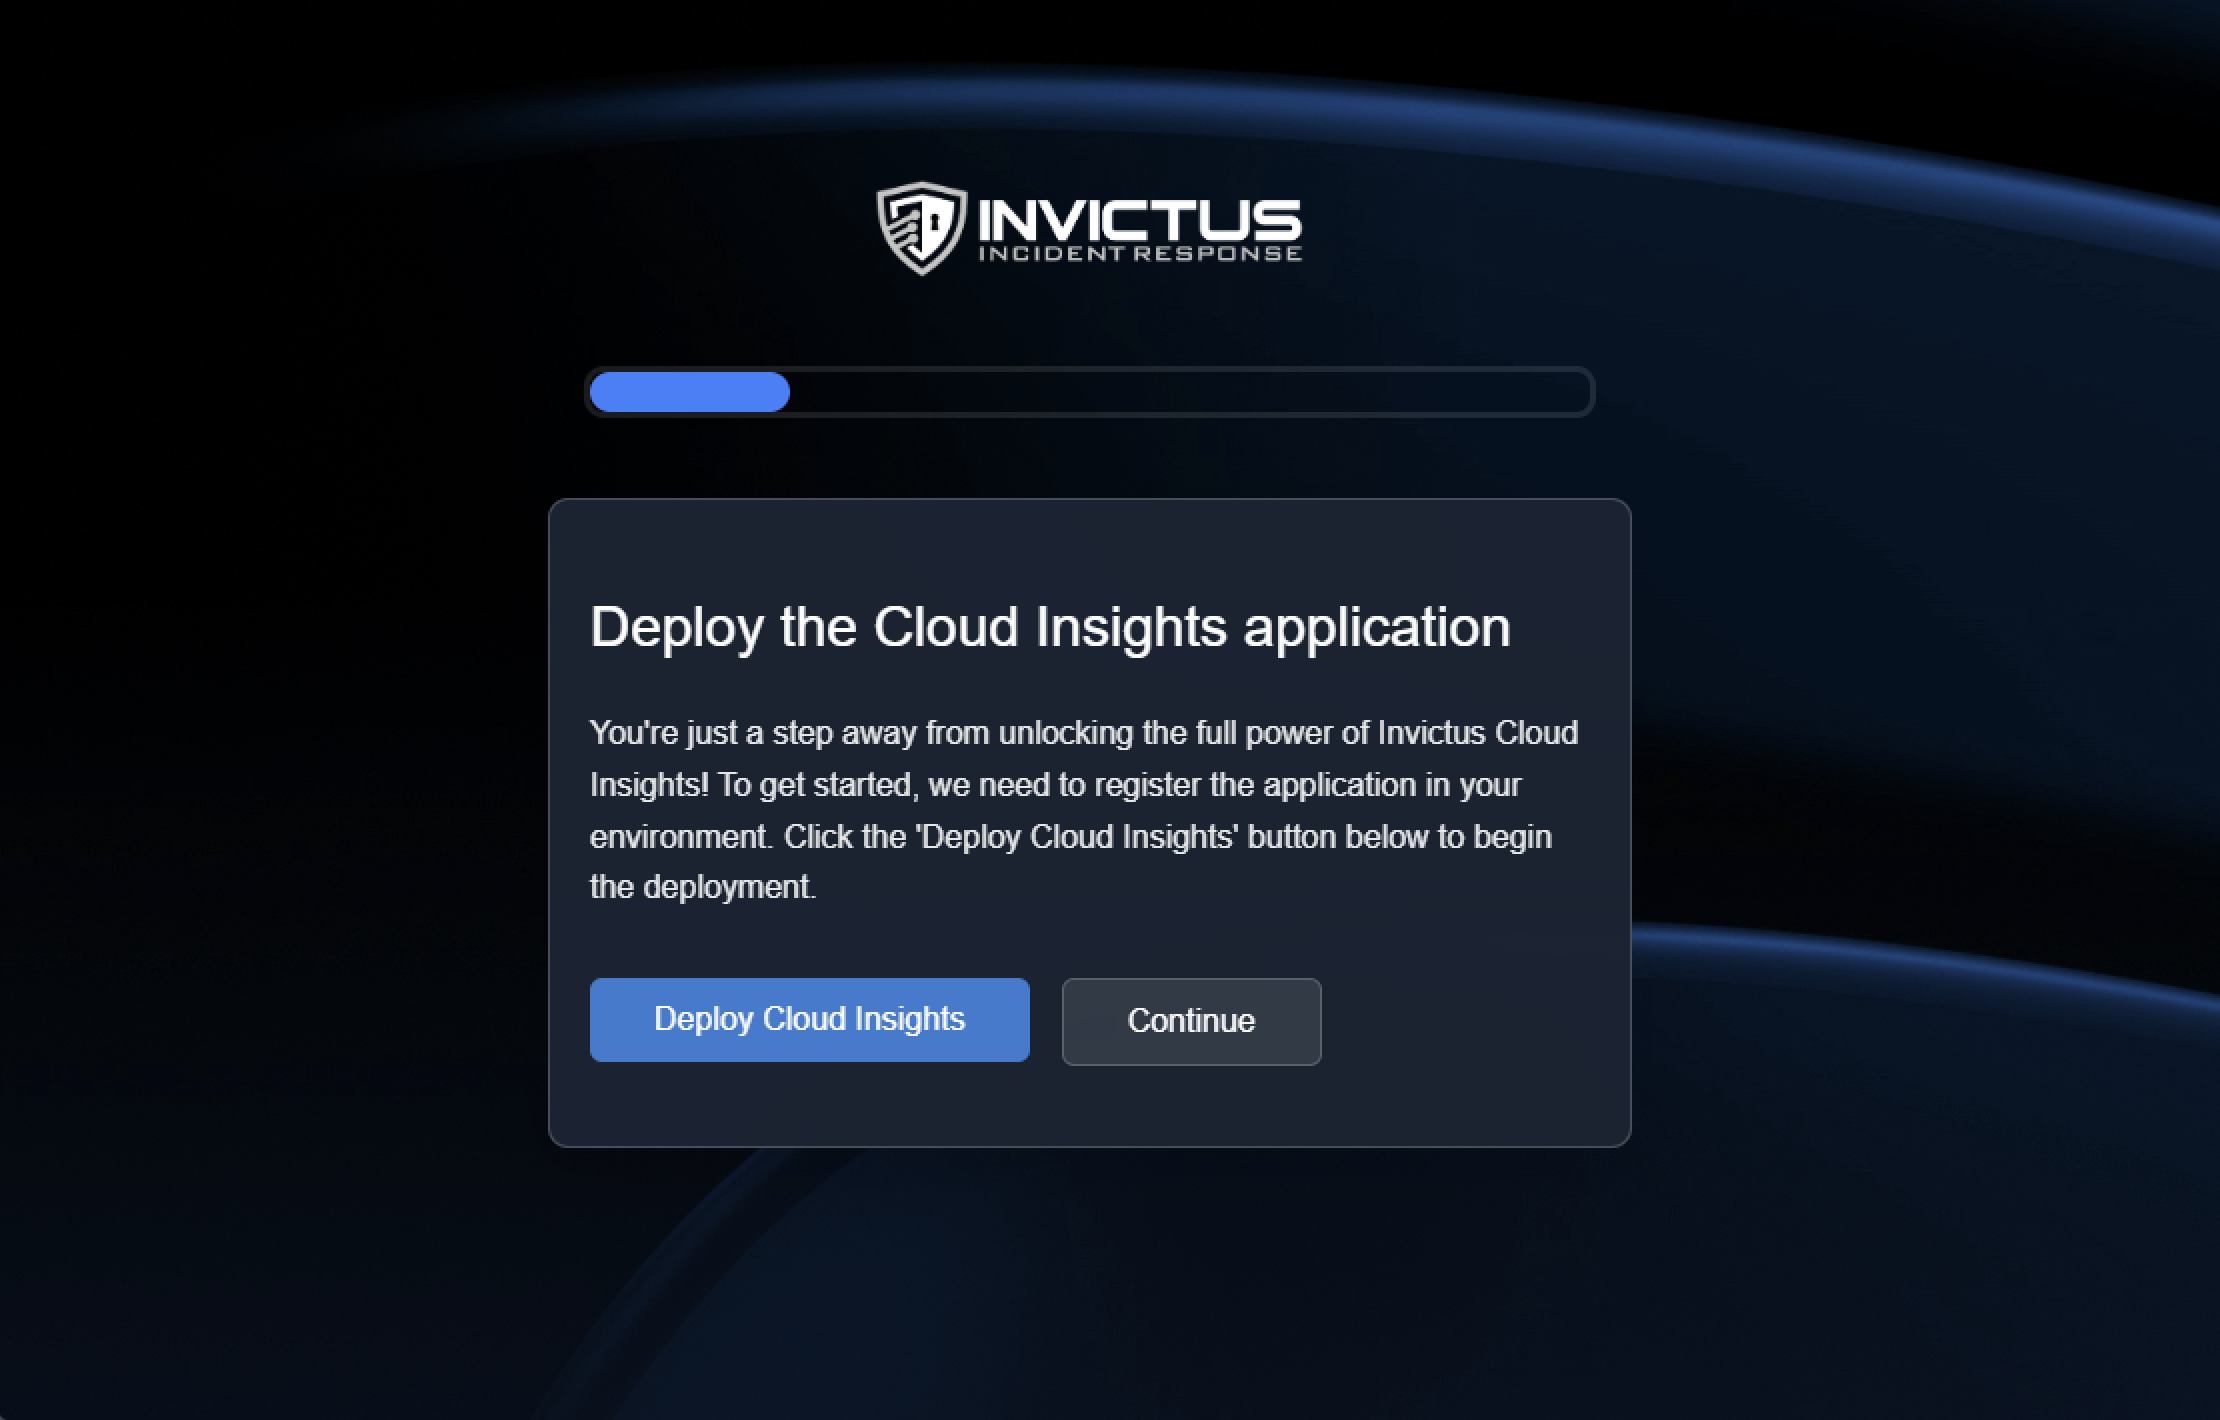
While these logs cover a lot, they aren’t always enough. For more in-depth investigations, we still need additional permissions, which require an extra setup step for the client. Our ultimate goal is to develop a one-click solution – but for now, it involves two steps. To make this easier, we built a cool looking portal in the Invictus style, which we share with clients. Through this portal, we guide them through each step, resulting in a multi-tenant application with all the required permissions for our investigations.
Working around Graph API limitations
To enable our application with the ability to execute commands and retrieve M365 log sources, we need to assign the Exchange.ManageAsApp permission to our multi-tenant application. The Exchange.ManageAsApp permission allows applications (rather than individual users) to access and manage Microsoft Exchange resources.
Next, we ask clients to assign the Global Reader Entra role and the View-Only Audit Logs permission to the application’s service principal. The Global Reader role is a read-only version of the Global Administrator role within Azure Active Directory (Azure AD) and Microsoft 365. It allows an application or user to view all settings and information across Microsoft 365 services, without the ability to change or manage them. The View-Only Audit Logs role further allows the application to access the Unified Audit Log.
To make this easy for clients, our portal leverages an Azure Logic App to automatically retrieve the service principal details of the deployed application. This information is then displayed directly on the website, so clients can simply copy and paste the provided command without having to search for the Service Principal Id themself:
Connect-AzureAD; Add-AzureADDirectoryRoleMember -ObjectId (Get-AzureADDirectoryRole | Where-Object {$_.DisplayName -eq "Global Reader"}).ObjectId -RefObjectId {SPID}; Connect-ExchangeOnline; New-ServicePrincipal -DisplayName "Invictus Acquisition" -AppId {APPId} -ServiceId "{SPID}"; New-RoleGroup -Name "Invictus UAL" -Roles "View-Only Audit Logs"; Add-RoleGroupMember -Identity "Invictus UAL" -Member "Invictus Acquisition"
With Global Reader and View-Only Audit Logs permissions granted, our application gains access to a valuable set of M365 logs, including:
- Unified Audit Log
- Transport Rules
- Inbox Rules
- Message Trace Logs (optional)
- Mailbox Audit Logs (optional)
Leveraging automation for log collection
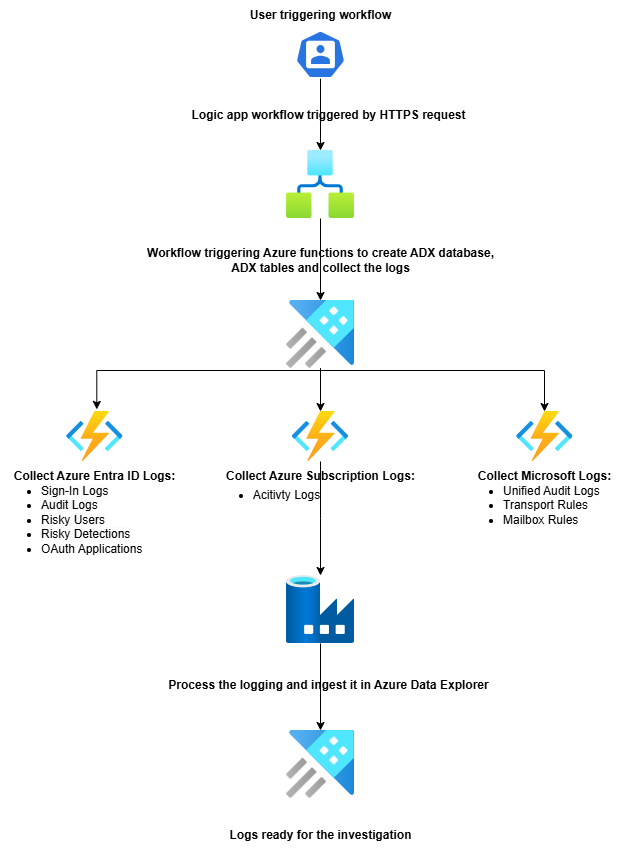
We’re big fans of using Azure Functions and Logic Apps for various tasks. Since we focus on all things cloud related, we wanted to build the entire solution using cloud-only services, and load logs directly into Azure Data Explorer (ADX).
Here’s how it works:
- When a new case starts, our client will use the sign-up flow in the portal, that triggers an Azure Logic App workflow.
- This flow creates a database in ADX and establishes tables for each log source, specifying the necessary fields.
- Multiple Azure Functions then acquire logs in parallel, ensuring we gather all data quickly and efficiently.
Scaling for Speed
For each log source, we have a separate function. The great thing about this setup is that we can run multiple functions in parallel, allowing us to quickly gather all the logs without waiting for them sequentially. In the future, we’d like to break down this process even further. Currently, one function is responsible for acquiring the entire Audit Log, but imagine splitting this into 10 functions, each handling a specific time window. This would make the acquisition process up to 10 times faster. We’re actively exploring this approach using Azure Durable Functions with an orchestrator setup. If anyone else is using an orchestrator setup for something similar, please let us know we'd love to pick your brain?
Automatic processing and detection
Once we acquire the data, Azure Data Factory pipelines kick in to process and organize it into the tables we’ve set up in Azure Data Explorer (ADX). With the data now structured in ADX, we’re ready to query and analyze it. But why stop there? We’ve decided to take it a step further with automated detection. While automation doesn’t replace in-depth, hands-on analysis, it helps us identify potential leads faster, providing starting points that guide our investigations.
How it works
We’ve set up multiple Azure Logic App workflows that listen to an Azure Service Bus message indicating that data acquisition and processing is complete. When a specific log source is ready, it triggers a workflow to initiate the detection rules.
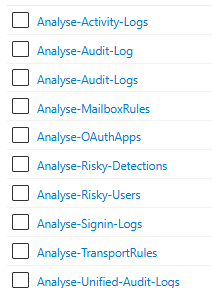
When one log source is processed, it triggers a workflow that runs all the detections. Below is our Sign-In Logs workflow, which contains multiple detection rules.

Each detection rule is set up in a separate Azure Function, allowing us to run all detections in parallel and make the automated detection process as fast as possible.
For example, in our Sign-in Logs workflow, we have detection rules, including:
- Azure Entra Device Code Authentication
- Azure Entra Successful Powershell Authentication
- Potential Brute Force Attack
- Sessions from Multiple IPs
- Impossible travel
- Suspicious login from a Tor exit node
- MFA fatigue attack followed by successful login
- AzureHound default user-agent detection
- AADInternals user-agent detection
This is a growing list, based on our investigations and open-source reports, we continuously add new detections. In total, we now have nearly 80 detection rules that run automatically on the collected log sources.
How detections are developed
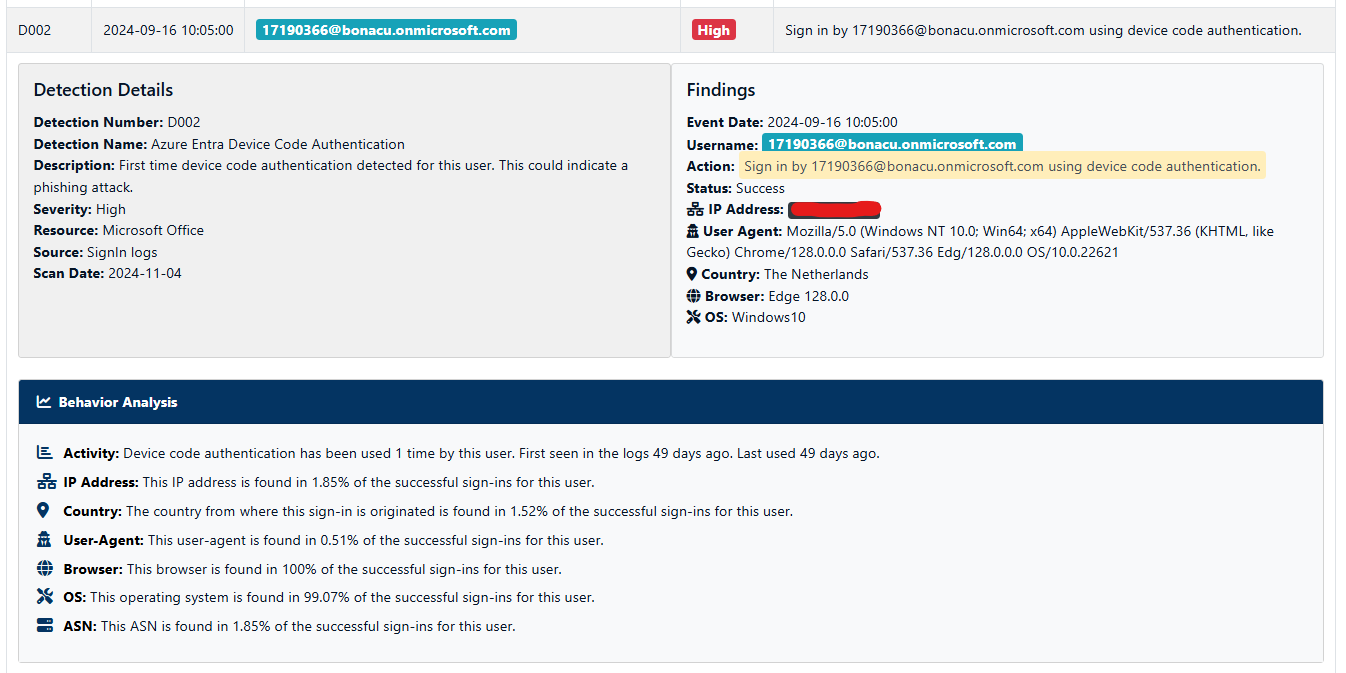
Each detection is a Powershell function using KQL (Kusto Query Language) to query the data in our Data Explorer cluster. In addition to the KQL query with the detection logic, in the function itself we also do some enrichment of the context, such as IP reputation. Each Azure Function also performs a baseline check, comparing current activity with historical data to understand if certain behaviors are typical for the user. For instance, for each sign-in detection, we examine:
- Activity Frequency – How often has this activity occurred in the past?
- IP Address – How common is this IP for the user’s sign-ins?
- Country – What percentage of logins originate from this country?
- User-Agent – How frequently is this user-agent seen in sign-ins?
- Browser – How often does the user sign in with this browser?
- Operating System – What percentage of logins use this OS?
- ASN – How common is this ASN in the user’s sign-ins?
This enriched data helps us reduce false positives by understanding user patterns. For example, a single sign-in via Device Code Authentication might trigger a high-priority alert, but if it’s part of the user’s regular behavior, we might lower the priority.
Storing and displaying findings
When a detection triggers an event, all relevant information is automatically written to our Azure Synapse Database. Since reading data directly from a database isn’t the most user friendly experience, we’ve developed a user-friendly webpage that displays all detection findings. This portal not only simplifies the review process of the alerts during incident response engagements for us, but also serves as a platform during Compromise Assessments. We give clients access so they can explore data and alerts firsthand. Additionally, the portal generates recommendations and other insights automatically, making it easier for clients to understand and act on the findings.
Conclusion
Our ultimate goal is to automate as much of the incident response process as possible, not because we believe the entire process can be automated, but to reduce the need for manual work. This approach allows us to spend less time on routine tasks, enabling us to focus on high-priority issues and deliver faster, more efficient service.
Additionally, we use this framework as a compromise assessment tool. By automating much of the process, we can offer this service at a more affordable rate, making it accessible to smaller companies with limited budgets.
We’re committed to helping as many organizations as possible, which is why we openly share our knowledge and make (most of) our tools available as open-source resources. We hope this approach will allow us to support more clients with smaller budgets, as these companies often have weaker security due to limited resources.
We’re always on the lookout for new ways to improve. If you have any questions or suggestions, please feel free to reach out, we’d love to hear from you!
About Invictus Incident Response
We are an incident response company and we ❤️ the cloud and specialize in supporting organizations facing a cyber attack. We help our clients stay undefeated!
🆘 Incident Response support reach out to cert@invictus-ir.com or go to https://www.invictus-ir.com/24-7
Be ready for the next cloud incident.

