Incident Response in Kubernetes (AKS)
Incident Response in Azure Kubernetes Service (Part 3)
The pager goes off at 3:00 AM, hopefully for the last time.
We have now been through two cloud providers. In AWS, we wrestled with opt-in logging and CloudWatch queries. In Google Kubernetes Engine (GKE), we found better defaults but a harder forensic floor in Autopilot. This time the alert is coming from an Azure Kubernetes Service (AKS) cluster on Azure. The attacker is the same. The environment, once again, is not.
Welcome to the final part of our series on Incident Response (IR) in a managed Kubernetes environment.
TL;DR
AKS does not enable Kubernetes-level audit logging by default; a freshly provisioned standard cluster has no record of API server activity until Diagnostic Settings are explicitly configured. During provisioning of a new cluster, Container Insights is checked by default.
At minimum, enable Kubernetes Audit Admin Logs, Guard, and Microsoft Defender for Containers at cluster creation. If you are reading this after an incident has already started and these were not enabled, your audit trail may be incomplete or absent entirely. AKS Automatic improves the default security posture by enforcing pod security standards and enabling Defender for Containers out of the box, but removes node-level forensic access in the same trade-off as GKE Autopilot.
Understanding AKS
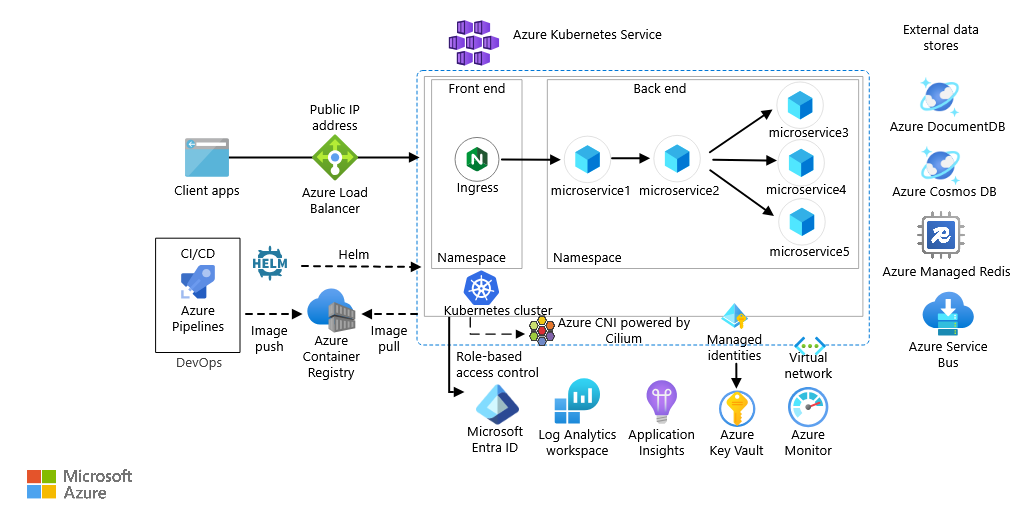
AKS is how Microsoft provides managed Kubernetes in Azure. It functions similarly to how EKS works. The management of the control plane is offloaded to Microsoft, leaving the operator with the responsibility of managing the data plane of the cluster. Integration of the service is visible in figure 1.
Azure provides AKS in two variants: regular and automatic. In regular mode, the operator manages the node pools directly: choosing VM sizes, handling OS patching and controlling scaling. Automatic mode shifts that responsibility to Microsoft as well. This mirrors GKE’s Autopilot mode, which was covered in part 2.
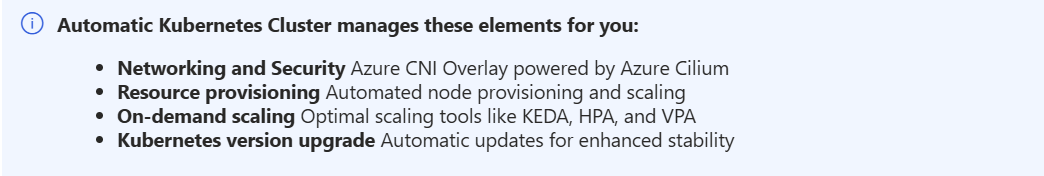
The security implications of that choice are meaningful. AKS Automatic improves the cluster’s security out of the box through enabling Container Insights by default, enforcing a restricted pod security standard, and running an image cleaner to remove unused images with known vulnerabilities. The trade-off is forensic access. In Automatic mode, the underlying nodes are managed by Microsoft and are not accessible to the operator. If a compromise occurs, an IR analyst cannot SSH into the node, snapshot the disk, or inspect the container runtime directly. The investigation is confined entirely to what Log Analytics received before the incident started.
Logging for AKS
Administrators within Azure can enable logging for resources via Diagnostic settings, which enable the streaming of logs to a centralized environment, such as Microsoft Sentinel.
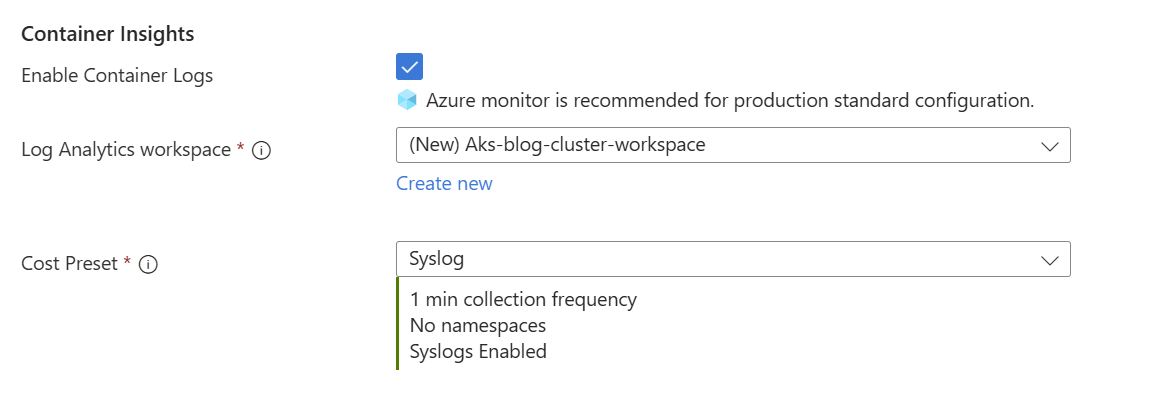
When creating the cluster via the Azure Portal, there are a multitude of options to configure logging, see table 1. Container Insights is checked by default in regular mode, but can be unchecked if preferred. If enabled, the logs are streamed to a specified log analytics workspace. The granularity of Container Insights (how frequently logs are collected and what is included) is configurable, see figure 3. Operators may reduce the frequency or content for cost reasons.
The following tables outline the available log sources for AKS investigations. These are divided by whether the log source is AKS native and how critical it is during an investigation. Ideally, all logs are streamed to the same centralized environment for easy correlation between different sources.
Investigating a possible threat
Now, let’s put this to the test in a realistic scenario. The principles that apply for investigating an alert are the same for any managed Kubernetes platform, be it AKS, GKE or EKS. Do not kill or restart an affected pod and do not log in to the compromised environment directly. If you have not read the earlier blogs regarding EKS/GKE, the short version is: your goal is to gather evidence without destroying forensic material. What changes in AKS is where you look and what tools you use.
Start with the logs
Open Log Analytics and query against the workspace your cluster is forwarding to. The language used for querying the logs is Kusto Query Language (KQL). The first step is to familiarize yourself with what data is available. Referring back to the ‘Recommended to enable’ section, the first step is to look at the audit logs.
If Kubernetes Audit Admin Logs are enabled, look for RBAC modifications, new deployments, or ClusterRoleBinding changes around the time of the alert. If Kubernetes Audit is enabled, broaden the search to include exec sessions and secret reads. Cross-reference any suspicious principal against the Guard logs to identify the underlying Entra ID identity behind the Kubernetes API call. If Container Insights is enabled, the application logs are queryable via the ContainerLogV2 table, look for unexpected shell invocations, outbound connections, or curl and wget calls that indicate post-exploitation activity.
Specific KQL queries for each of these scenarios are covered in the Investigating in Log Analytics section below.
KubeForensys
In the worst case scenario, none of the logs are enabled, leaving you as an investigator with not much to go on. We, from Invictus IR, developed a tool named Kubeforensys which leverages the Kubernetes API to extract as much data as possible from the AKS cluster. It is able to extract:
- Kubernetes pods logs
- Kubernetes Events
- The command history if present on containers
- Service accounts
- Possible suspicious pods
- RBAC bindings
- Cron Jobs
- Network policies
Which are then pushed towards a newly created log analytics workspace, granting the IR analyst to have a better understanding of the state of the cluster post-compromise.
Containment & Eradication
The containment process is the same as for EKS and GKE. You do not want to kill the compromised pod, as that would destroy forensic evidence. Rather, quarantine it so the connection to a possible C2 server is severed. The quarantine approach is identical for any Kubernetes environment; NetworkPolicy operates at the Kubernetes layer and is consistent across all managed Kubernetes platforms:
apiVersion: networking.k8s.io/v1
kind: NetworkPolicy
metadata:
  name: quarantine
spec:
  podSelector:
    matchLabels:
      app: YOUR_APP_LABEL
  policyTypes:
    - Ingress
    - Egress
Remove the pod's labels so the load balancer stops routing production traffic to it:
kubectl label pod YOUR_POD_NAME app-The pod is now isolated from both the internet and your production traffic, but still running, giving you the opportunity to continue your investigation without the attacker knowing you have acted.
Mapping to Kubernetes TTPs
Microsoft released the threat matrix for Kubernetes, providing a way to map attacker behaviour to goals, which are described as Tactics, Techniques and Procedures (TTPs) (see figure 4).

We can use this matrix to see where behaviour would be detected, as shown in table 2. Note that this table is non-exhaustive, as certain tactics can be found in multiple log sources, depending on the technique used.
Investigating in Log Analytics
The following scenarios illustrate how KQL can be used to detect common attack patterns in AKS. The queries below target the Log Analytics workspace your cluster forwards to via Diagnostic Settings.
Scenario: kubectl exec abuse
As in EKS and GKE, kubectl exec grants an attacker a shell inside a running pod. In AKS, this activity is captured in the AKSAudit table. The exec call encodes the command and target container as URL parameters in the RequestUri field, which requires a small amount of parsing to make readable:
AKSAudit
| where TimeGenerated > ago (7d)
| where RequestUri has "exec"
| extend Parsed = parse_url(strcat("https://dummy",RequestUri))
| extend
CommandRaw = url_decode(tostring(Parsed['Query Parameters'].command)),
Container = url_decode(tostring(Parsed['Query Parameters'].container)),
TTY = url_decode(tostring(Parsed['Query Parameters'].tty))
| extend Command = strcat_array(todynamic(CommandRaw), " ")
| project TimeGenerated , Level, Verb, RequestUri, UserAgent, Command, Container, TTY
| order by TimeGenerated desc
This query surfaces more context in a single result row than the equivalent queries in the blog posts for EKS and GKE. The Command field shows exactly what was executed, Container identifies which container inside the pod was targeted, and TTY indicates whether an interactive terminal was allocated.
As with previous parts, exec activity is not inherently malicious. Correlate the UserAgent, source identity from the Guard logs, and the executed command against expected administrative behaviour before drawing conclusions.
Note that this query requires Kubernetes Audit logs to be enabled in Diagnostic Settings. If they were not enabled before the incident, exec activity leaves no trace in Log Analytics. Since it concerns a read operation (given the ‘get’ verb used), this activity would not display in AKSAuditAdmin (the Kubernetes Audit Admin logs).
Scenario: Writable hostPath mount
A writable hostPath mount is one of the more dangerous misconfigurations possible in a Kubernetes cluster. By mounting a path from the underlying node's filesystem directly into a container, an operator (or an attacker) gives that container read and write access to node-level files. If the mount point is /, the container can read sensitive files such as /etc/shadow, modify node binaries, or plant persistence mechanisms on the node itself, effectively escaping the container boundary through configuration alone.
To emulate such an attack, we can create a pod spec with a writable hostPath mount pointing to the node's root filesystem:
apiVersion: v1
kind: Pod
metadata:
  name: hostpath-demo
spec:
  containers:
  - name: hostpath-demo
    image: nginx
    volumeMounts:
    - mountPath: /host
      name: host-vol
  volumes:
  - name: host-vol
    hostPath:
      path: /
      type: Directory
Once the pod is running, exec into it and demonstrate node filesystem access:
kubectl exec -it hostpath-demo -- /bin/sh -c 'ls /host/etc | head -n 5'
Detecting it in Log Analytics
Unlike most post-exploitation techniques, a hostPath mount is detectable at pod creation time, before the attacker has done anything with the mount. The pod spec is included in the Kubernetes Audit Admin log entry, making it queryable:
AKSAuditAdmin
| where TimeGenerated > ago(7d)
| where Verb == "create"
| where RequestUri has "pods"
| extend PodSpec = parse_json(RequestObject)
| extend Volumes = PodSpec.spec.volumes
| where Volumes has "hostPath"
| project TimeGenerated, UserAgent, RequestUri, Volumes
| order by TimeGenerated desc
The result tells you when the pod is created, from what client, and what the hostPath configuration was. On a regular AKS cluster where hostPath mounts are permitted, this query should return no results during normal operations; any hit is worth investigating immediately.
Conclusion
Wrapping the series about IR in managed Kubernetes environments up, there is one consistent finding across the three cloud providers (Azure, AWS, GCP): the logs most valuable to an IR team are never the ones enabled by default.
In EKS, control plane logging is opt-in and thus silent until you configure it. In GKE, three sources are enabled by default but the most interesting one (Data Access Audit log) is not enabled by default. The situation for AKS is comparable; the Kubernetes Audit log logs the most interesting events but is very verbose in the process. Each platform has its own defaults, its own query language, and its own identity model, but the gap between what the platform can show you and what it shows you out of the box is a constant across all three.
Across all three platforms, the practical preparation comes down to the same three actions.
- Enable audit logging before an incident starts; on all three platforms the most investigatively valuable logs are opt-in, and they cannot be reconstructed after the fact.
- Forward logs to a destination outside the cluster's blast radius, so an attacker who compromises the cluster cannot also erase the evidence.
- Audit your identity bindings: IRSA in EKS, Workload Identity in GKE, managed identities in AKS, because the lateral movement path from a compromised pod to cloud services runs through those bindings, and least privilege on pod identities limits the blast radius before a container compromise becomes a cloud compromise.
Unfortunately, the pager will almost certainly go off again (hopefully not at 3AM). The question now becomes are you ready?
About Invictus Incident Response
We are an incident response company and we ❤️ the cloud. We help our clients stay undefeated.
🆘 Incident Response support: reach out to cert@invictus-ir.com or go to https://www.invictus-ir.com/24-7
Be ready for the next cloud incident.